About TexMesonet
Overview
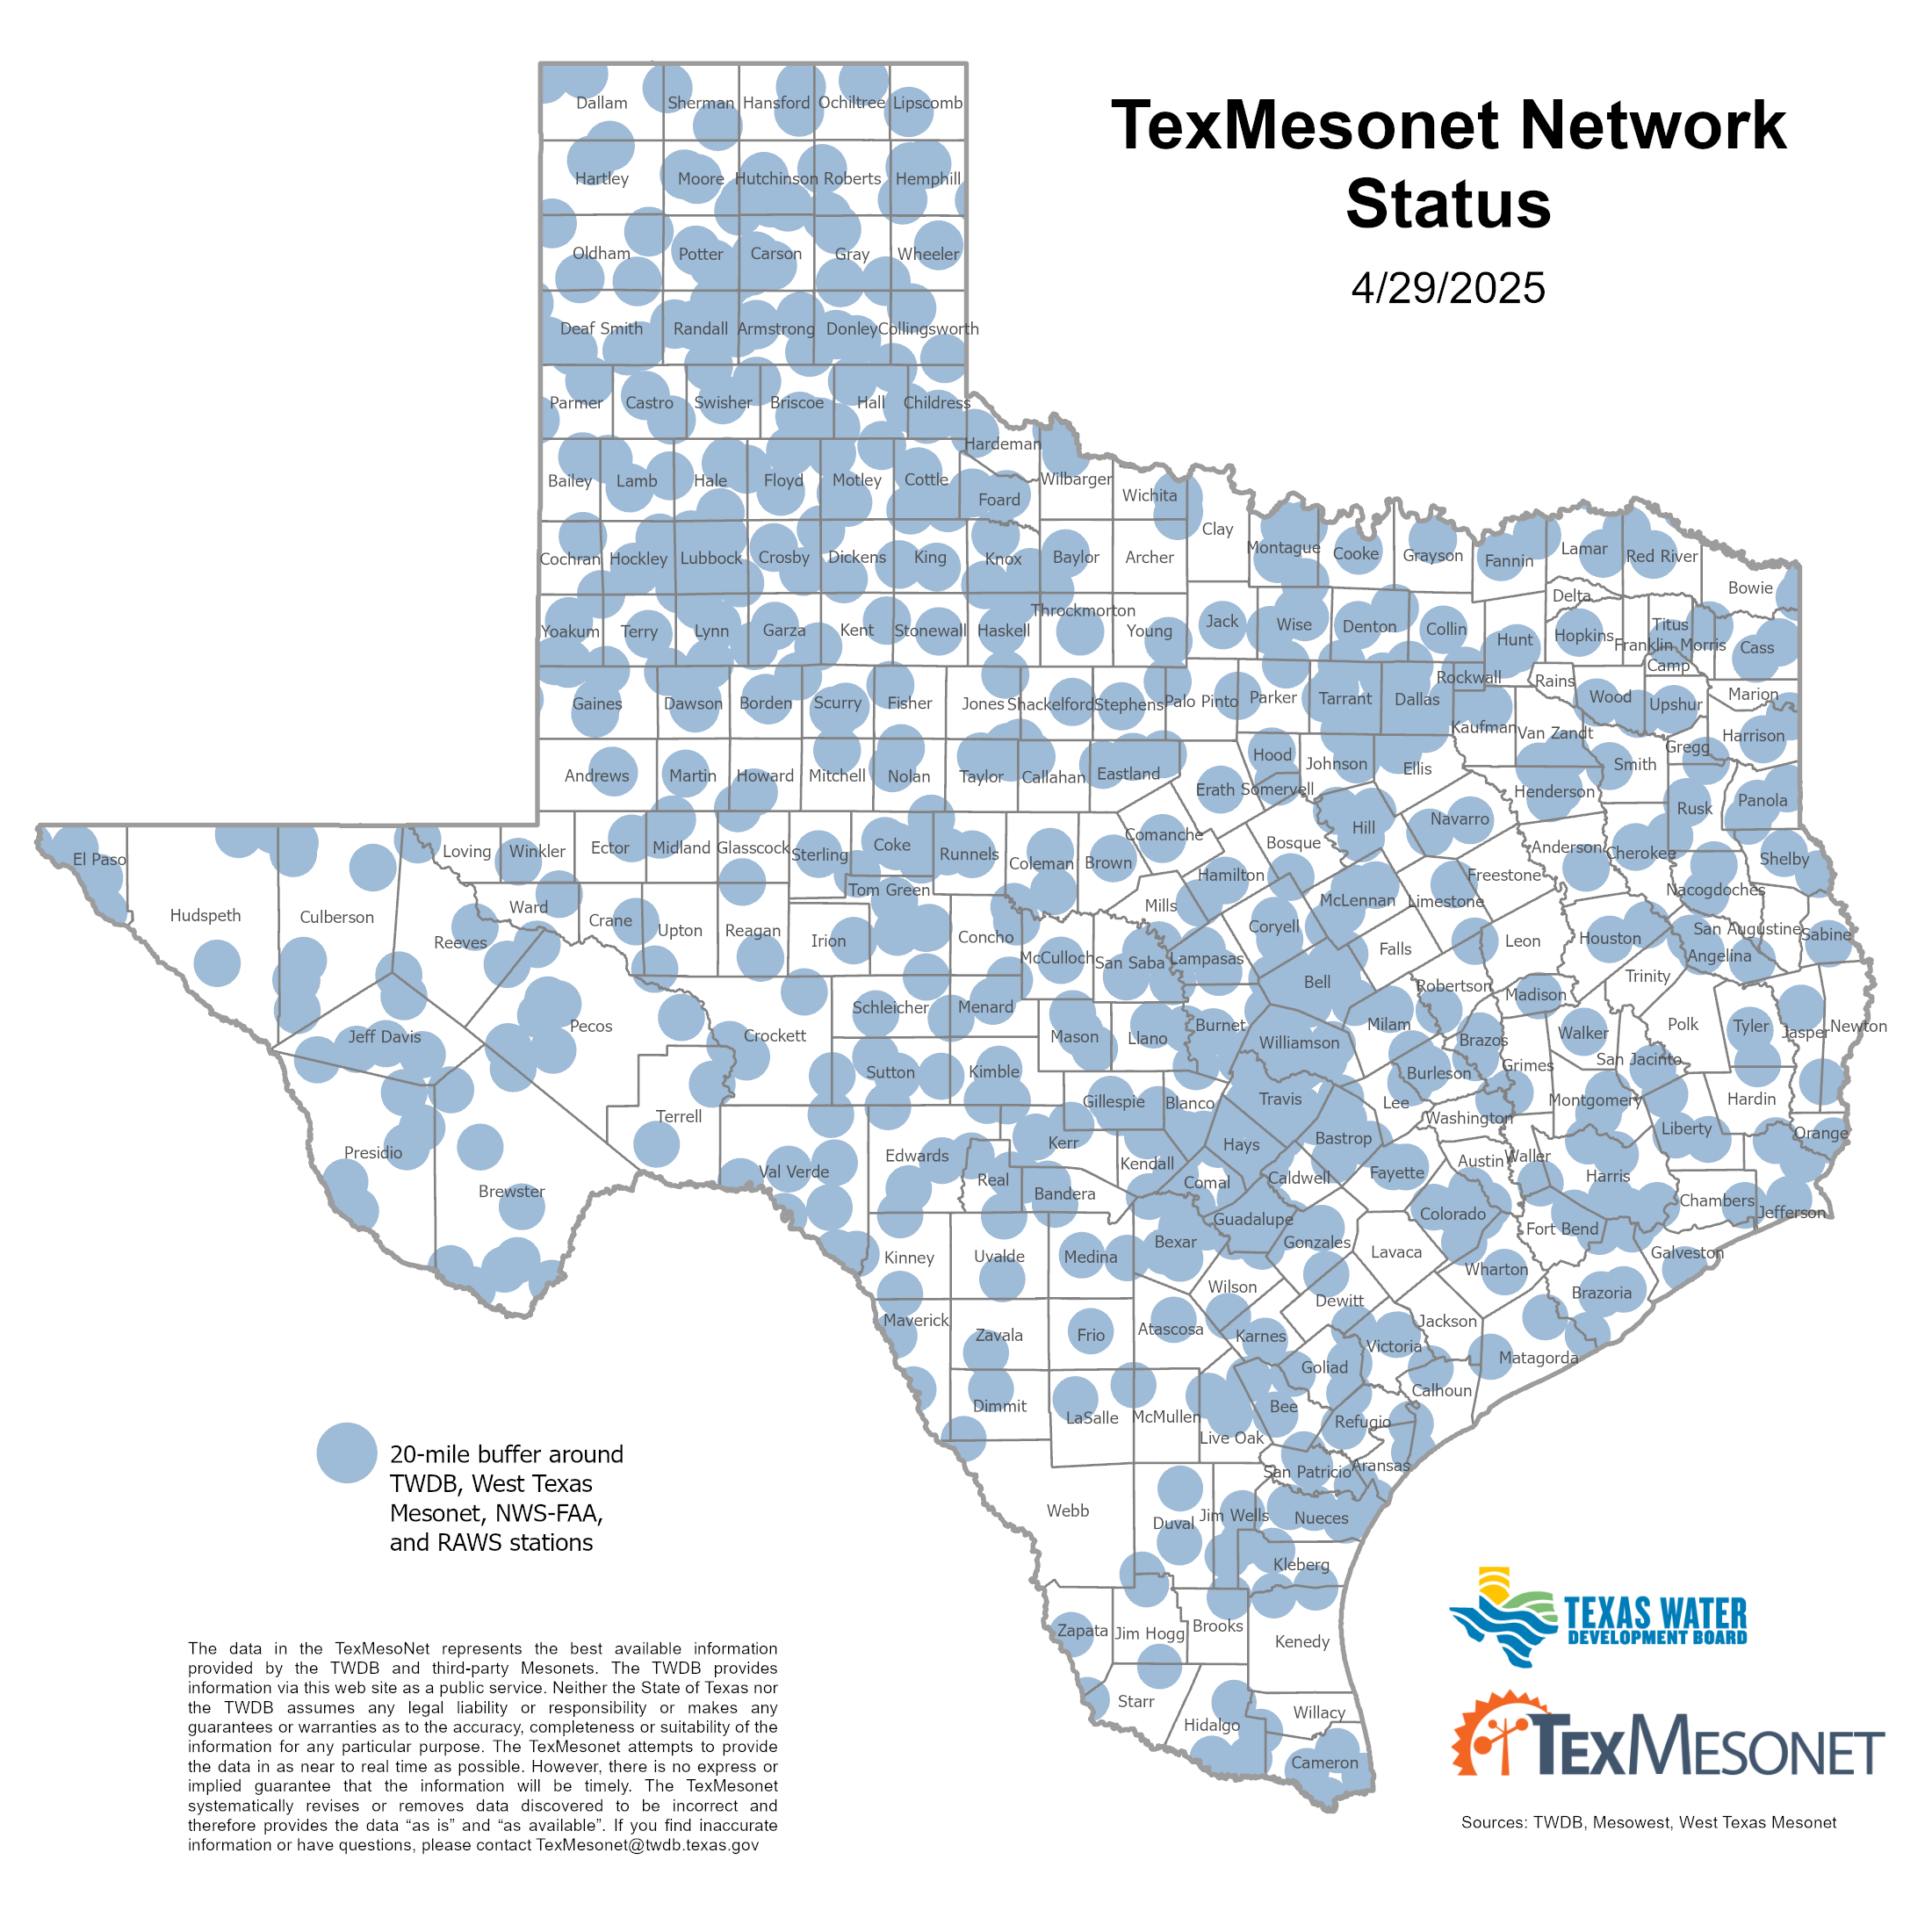
Together with partners across the state, the Texas Water Development Board (TWDB) has developed TexMesonet — a statewide earth observation data collection network.
TexMesonet establishes a unifying architecture for networks across Texas, aggregating data into one central location that includes stations maintained by the National Weather Service (NWS) and several other regional and local entities. And, TWDB continues to strategically add its own managed stations to improve statewide coverage.
TexMesonet utilizes MesoWest and SynopticLabs Mesonet API to access data from these stations as well as independent meteorological stations, including several buoy sites in the Gulf of Mexico. Many citizen-cooperator sites or special-purpose networks measure only one or two parameters. Collectively, these several hundred locations contribute meaningfully to the complete meteorological data presented by and available on TexMesonet.
Data Information
What data is displayed and graphed?
The TexMesonet Map Viewer shows the current conditions for all mesonet stations. Detailed information can be displayed for each station by either hovering over or clicking on the station. Clicking opens a pop-up where you can choose to view:
- Current – This is the most recent data read at varying intervals (5 min. for TWDB stations). Date and time of the read is shown at the bottom, and data collected varies by station.
- Forecast – The current forecast from the NWS for the station site.
- Graphs – Shows data trends over the previous 1, 2, 3 days, or 1 to 2 weeks. Graphs will only display if data is available.
Data Fields Collected
| Dew Point | Average dew point in degrees Fahrenheit |
| Heat Index | Shown if temperature is > 80°F |
| Humidity | Relative Humidity as a percent of 100 |
| Precipitation | Precipitation in inches from rain gage |
| Sea Level Pressure | Barometric pressure in millibars (mb) |
| Solar Radiation | Average incident solar radiation in watts per square meter |
| Soil Moisture | Percentage volume of water to volume of soil (i.e. volumetric soil moisture) measured at 5cm, 10cm, 20cm, and 50cm depths |
| Soil Temperature | Soil Temperature in Fahrenheit measured at 5 cm, 10cm, 20 cm, and 50 cm depths |
| Temperature | Air temperature in degrees Fahrenheit at 2m and 9m heights |
| Water Level | Water level in feet below ground. (For well sites) |
| Water Temperature | Water temperature of water below ground. (For well sites) |
| Wind Chill | Shown if temperature is < 50°F |
| Wind Direction | Wind direction in compass degrees at 2m and 10m heights |
| Wind Gust | Wind gust speed in miles per hour at 2m and 10 m heights |
| Wind Speed | Wind speed in miles per hour measured at 2m and 10m heights |
Data Sources
| Mesonet | Description |
| COA | City of Austin Flood Control |
| CRN | Climate Reference Network |
| EAA | Edwards Aquifer Authority |
| GBRA | Guadalupe-Blanco River Authority |
| GPTX | City of Grand Prairie |
| HADS | Hydrometeorological Automated Data System |
| HCFCD | Harris County Flood Control District |
| JCDD6 | Jefferson County Drainage District No. 6 |
| LCRA | Lower Colorado River Authority |
| MARITIME | Moored Buoys and CMAN |
| MEXICO | Servicio Meteorologico Nacional (Mexico) |
| NOS-NWLON | National Ocean Service Water Level Observation Network |
| NOS-PORTS | National Ocean Service Physical Oceanographic Real-Time System |
| NWS/FAA | National Weather Service/Federal Aviation Administration |
| RAWS | Interagency Remote Automatic Weather Stations |
| SJRA | San Jacinto River Authority |
| TWDB | Texas Water Development Board |
| TXSON | Texas Soil Observation Network |
| WTEXAS | West Texas Mesonet |
How is data collected and distributed?
- Data is collected using Campbell Scientific Dataloggers (CR1000 and CR1000X). The data is currently logged at 5-minute intervals
- LoggerNet retrieves the data from each of the stations every 5 minutes. Shortly afterwards the data is loaded into the database.
- Our web services drive the near real time data distribution and display on https://www.texmesonet.org. See our Data Services page for more information.
What is the source for our weather radar?
TexMesonet displays the National Weather Service (NWS) Next-Generation Radar (NEXRAD) network of weather via services from Iowa State University of Science and Technology. For more information visit the Iowa Environmental Mesonet (IEM).
What are some uses of the data?
The data is broadly applicable. For example:
- Support statewide flood monitoring and flood forecasting
- Monitoring and response to drought and wildfires
- May help with more efficient irrigation in both rural and urban contexts
New parameters and functional enhancements are added on an ongoing basis with the goal to help all Texans more easily monitor, interpret, and utilize the network’s data.